
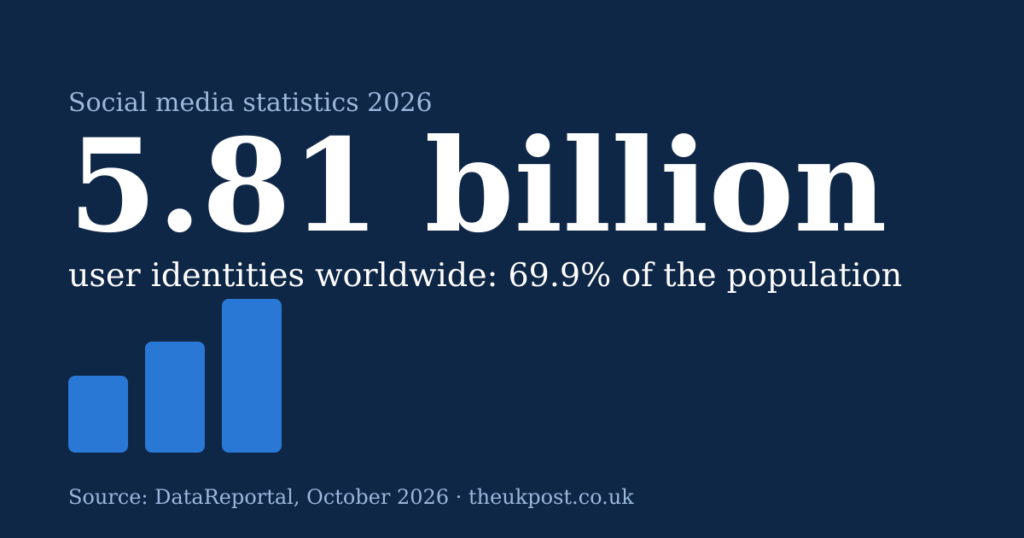
About 5.81 billion social media user identities existed worldwide at the start of October 2026. That is 69.9% of the world’s population and 94.5% of internet users, according to DataReportal. The figure counts accounts, not unique people, so the number of real individuals is lower.
Facebook, Instagram, YouTube and WhatsApp are the most-used platforms: each is used by roughly 55% to 58% of internet users aged 16 and over (GWI, Q2 2026). The average person uses about 6.7 platforms a month and spends around 19 hours 18 minutes a week on social platforms.
This guide uses company filings and results where platforms publish them. Where they do not, it uses named research bodies such as DataReportal, Pew Research Center and Ofcom. Every figure shows its metric, period and source, and anything that is not publicly confirmed is marked as such. Last verified: 7 November 2026.
Social Media Statistics at a Glance (2026)
| Statistic | Latest figure | Period | Source (type) |
|---|---|---|---|
| Global social media user identities | 5.81 billion | Start of October 2026 | DataReportal (third-party compiled) |
| Share of world population | 69.9% | October 2026 | DataReportal |
| Annual growth in identities | +151 million (+2.7%) | October 2025 to October 2026 | DataReportal |
| Internet users who use social media | 94.5% | October 2026 | DataReportal |
| Most-used platform (self-reported) | Facebook: 58.1% of internet users aged 16+ (Instagram 56.6%, YouTube 56.2%, WhatsApp 54.9%) | Q2 2026 | GWI, via DataReportal (survey) |
| Time spent on social platforms | 19 hours 18 minutes a week | Latest GWI figure in DataReportal’s October 2026 update | GWI (survey) |
| Platforms used per month | 6.7 on average | Latest GWI figure | GWI (survey) |
| Meta’s combined daily audience | 3.64 billion people | September 2026 average | Meta Q3 2026 results (company-reported) |
How many people use social media worldwide?
DataReportal reports 5.81 billion social media user identities at the start of October 2026. That is 151 million more than a year earlier, or about 4.8 new identities every second. The chart shows three DataReportal snapshots. They differ because they cover different dates, not because they contradict each other. DataReportal also revised some of its underlying data in 2026, so compare only figures from the same series.
Global social media user identities (billions)
An identity is an account counted in a cross-platform estimate. Duplicate accounts, business accounts and people using several apps can push the total above the number of real individuals. DataReportal also notes that comparing identities with total population can understate use, because most platforms only allow users aged 13 and over.
Social media user identities as a share of the world’s population
What percentage of internet users use social media?
DataReportal puts it at 94.5% of internet users of all ages each month (October 2026). Internet users number 6.15 billion, or 73.9% of the world’s population, up 54 million (+0.9%) in a year, according to the DataReportal global overview. In a separate GWI survey, 97.1% of internet users aged 16 and over in 53 large economies used at least one social network or messaging platform in the past month.
With overlap this high, most new social media identities now come from people getting online for the first time, not from existing internet users signing up.
How to Understand Social Media Statistics
Platforms count users in different ways, so two numbers with the same label can mean different things. These are the measures you will meet in this guide.
Monthly active users (MAU)
MAU counts people who used a service at least once in a month. It shows reach, not habit. Pinterest, for example, counts a logged-in user who visits, opens the app or uses the Save button within a 30-day period (see its Q2 2026 filing).
Daily active users (DAU)
DAU counts people active on a given day. Snap averages it across every day in a quarter. Dividing DAU by MAU gives a rough sense of habit: Snapchat’s DAU was about half its MAU in Q3 2026 (495 million against 977 million, from its 10-Q). Do not compare a DAU from one platform with a MAU from another.
Daily active people (DAP)
DAP is Meta’s “family” measure: the estimated number of people who use at least one Meta app on an average day. It covers apps such as Facebook, Instagram, Messenger and WhatsApp together, so it is not a Facebook figure. Meta reported 3.64 billion for September 2026, up 3% year on year (Meta Q3 2026 results).
Daily and weekly active uniques (DAUq and WAUq)
Reddit counts unique visitors per day or week, whether or not they are logged in. In Q2 2026, 77.7 million of its 130.3 million daily uniques were logged out, against 52.6 million logged in (Reddit Q2 2026 results). A unique visitor is not a registered account.
Registered accounts vs active users
Registered accounts include inactive, duplicate and automated profiles. LinkedIn’s 1.3 billion-plus figure is registered members, not monthly users, and LinkedIn does not publish a MAU. DataReportal flags the same point when it lists LinkedIn’s ad reach.
Advertising reach vs actual users
Ad reach is the audience a platform’s advertising tool says an advertiser could reach. DataReportal states that these figures are not directly comparable with active-user numbers. Ad tools also change: Meta recently removed a significant number of accounts from Facebook’s ad audience, per DataReportal.
Reported advertising reach by platform (billions)
Company-reported vs third-party statistics
Company figures come from filings, results releases and earnings calls (Meta, Reddit, Pinterest, Snap). Third-party figures fill the gaps: DataReportal compiles estimates, Pew and GWI run surveys, and Ofcom uses panel measurement. Survey and modelled numbers are estimates, so we label them.
Social Media Statistics by Platform (2026)
Only compare figures that use the same metric. The table gives each platform’s best current figure with its exact label. It is not a league table.
| Platform | Metric | Figure | Period | Type |
|---|---|---|---|---|
| Meta (all apps) | Daily active people | 3.64 billion | September 2026 average | Company-reported |
| Monthly active users (last reported) | 3.07 billion | December 2023 | Company-reported; per-app reporting stopped | |
| Monthly / daily active users | 3 billion / 2 billion | September 2025 / July 2026 | CEO statements on earnings calls | |
| Monthly active users | 3 billion+ | April 2025 | CEO statement on earnings call | |
| YouTube | Not published; ad reach | 2.77 billion (ad reach) | Late 2026 | DataReportal (ad tools) |
| TikTok | Global MAU: not publicly confirmed; ad reach | 2.33 billion (adults 18+, ad reach) | Late 2026 | DataReportal (ad tools) |
| X | Monthly active users, X and Grok combined | About 550 million | 31 March 2026 | SpaceX S-1 filing |
| Daily / weekly active uniques | 130.3 million / 515.2 million | Q3 2026 | Company-reported | |
| Snapchat | Daily / monthly active users | 495 million / 977 million | Q3 2026 | Company-reported |
| Monthly active users | 661 million | Q3 2026 | Company-reported | |
| Registered members | 1.3 billion+ | April 2026 | Company-reported (not MAU) | |
| Telegram | Monthly active users | 1 billion+ | March 2025 | Founder statement |
| Tumblr | Active users: not publicly confirmed | n/a | n/a | EU figure only (see below) |
Share of internet users aged 16+ who used each platform in the past month
So which platform is biggest? On self-reported use Facebook leads by a narrow margin. DataReportal’s app-usage index (Similarweb, August 2026) puts WhatsApp first and YouTube a close second, and YouTube has the largest ad reach. The top four are close, and the order depends on the measure.
Facebook statistics
- Meta’s combined audience: 3.64 billion daily active people in September 2026, up 3% year on year. This covers all Meta apps, not Facebook alone (Meta Q3 2026 results, 21 October 2026).
- Last Facebook-only figure: 3.07 billion monthly active users in December 2023 (Meta Q4 2023 results). Meta stopped routine per-app reporting afterwards, so pages that still call 3 billion “current” are quoting old data.
- Ad reach: 2.32 billion (late 2026, DataReportal).
- Share of people: 58.1% of internet users aged 16+ (GWI, Q2 2026); 70% of US adults (Pew, survey of 30 January to 18 June 2026).
Meta Family daily active people (billions)
Instagram statistics
- Monthly active users: 3 billion, announced by Mark Zuckerberg in September 2025 (Social Media Today).
- Daily active users: 2 billion, stated on Meta’s Q2 2026 earnings call on 29 July 2026 (reported here). Both are statements, not routine filing metrics.
- Ad reach: 1.96 billion (DataReportal). India is the largest ad audience at 515 million, ahead of the US at 180 million (DataReportal India, US).
- US adults: 51% use Instagram, rising to 79% of those aged 18 to 29 and 21% of those aged 65 and over (Pew, 2026 fact sheet).
Instagram: three different numbers
X (formerly Twitter) statistics
- Monthly active users: about 550 million for X and Grok combined on 31 March 2026, up from about 520 million in December 2025, according to SpaceX’s S-1 filing. About 117 million of them used Grok’s AI features.
- Compared with earlier claims: the filing figure is below the 600 million X had repeatedly claimed (Social Media Today).
- X-only users and daily active users: not publicly confirmed. X users post about 350 million times a day, but posts and views are not users.
- Audience: 21% of US adults use X (Pew, 2025). In the UK it is the only top-10 social service where men are the majority of visitors, at 60% (Ofcom, May 2025).
Reddit statistics
- Daily active uniques (DAUq): 130.3 million in Q3 2026, up 12% year on year.
- Weekly active uniques (WAUq): 515.2 million in Q3 2026, up 16% (Reddit Q3 2026 results).
- Where they are: in Q2 2026, 77.1 million daily uniques were outside the US and 53.2 million in the US.
- Reddit says it has more than 100,000 active communities. Subreddit counts and sizes change daily, so check Reddit’s own community pages for live numbers.
- In the US, 26% of adults use Reddit (Pew, 2025).
Reddit daily active uniques: logged out vs logged in (Q2 2026)
TikTok statistics
- Global monthly active users: not publicly confirmed in a filing we could verify. Third-party estimates range from about 1.6 billion (Sensor Tower, as reported here) to more than 2 billion (CnTechPost, April 2026).
- Ad reach: 2.33 billion adults aged 18+ globally, and 150 million in the US (DataReportal, US report).
- US adults: 37% use TikTok (Pew, 2025). In the UK, 56% of online adults used it in May 2025, and 18- to 34-year-olds spent an average of 49 minutes a day on it (Ofcom).
If you are a creator, our guides cover the best time to post on TikTok and how much TikTok pays for 1 million views.
YouTube statistics
- Users: Alphabet does not publish a current monthly user count. The 2.7-billion-plus figure in many articles traces back to ad reach (analysis here). DataReportal’s ad reach is 2.77 billion (late 2026).
- US adults: 84% use YouTube, the highest of any platform (Pew, 2026 fact sheet).
- UK: 94% of online adults used it in May 2025, spending 51 minutes a day (Ofcom, Online Nation 2025).
- India: the largest ad audience at 573 million (DataReportal).
Creators wondering what that audience is worth can read how much YouTube pays.
WhatsApp statistics
WhatsApp passed 3 billion monthly active users in April 2025, according to Meta’s CEO (Nairametrics). Meta has not given a newer standalone figure. WhatsApp is counted inside Meta’s 3.64 billion daily active people. More detail is in the messaging section below.
LinkedIn statistics
- Registered members: more than 1.3 billion (LinkedIn, April 2026). This is not a monthly active user count.
- Ad-tool figures also count registered members: 300 million in the US and 53.0 million in the UK (DataReportal US, UK).
- Audience: LinkedIn’s UK ad audience is 54.3% male (DataReportal, late 2026).
Snapchat statistics
- Daily active users: 495 million in Q3 2026, up 4% year on year.
- Monthly active users: 977 million, up 4% (Snap 10-Q).
- North America: 92 million daily users, down 6% in a year; Europe held at 98 million (Stock Titan summary).
- Snap plans to lead with monthly rather than daily users from Q1 2027.
Our guide to Snapchat users has the longer history.
Pinterest statistics
- Monthly active users: 661 million in Q3 2026, an all-time high and up 10% year on year (Pinterest Q3 2026 results).
- Regions: 394 million in the rest of the world, 161 million in Europe and 107 million in the US and Canada, as reported in coverage of the results (rounded).
- Audience: Pinterest’s UK ad audience is 71.2% female (DataReportal, late 2026).
Pinterest monthly active users by region (Q3 2026)
We track the figures over time in our page on Pinterest monthly active users.
Telegram statistics
Telegram’s founder, Pavel Durov, said in March 2025 that the app had “significantly over” 1 billion monthly active users (TechCrunch). This is a self-reported figure and has not been independently audited. In India, 52.6% of internet users aged 16+ used Telegram in the past month (GWI, Q2 2026).
Tumblr statistics
Tumblr does not publish a regular global active-user count. Its EU transparency page says average monthly active recipients in the EU were under half the 45 million threshold on 1 January 2026 (Automattic). Tumblr hosts more than 600 million blogs, but a blog is not a user. The 135 million monthly users quoted on many sites is not traced to a Tumblr disclosure, so treat it as an unverified estimate. For what is trending now, see Tumblr’s own trending page.
Social Media Demographics and Audience Statistics
Demographic figures come from surveys, so they depend on who was asked, where and when. The data below is for named samples only.
Social media usage by age group
Pew groups US adults as 18–29, 30–49, 50–64 and 65+, so finer bands such as 18–24 are not available from this source. The table shows the share of US adults in each group who ever use each platform.
| Platform | 18–29 | 30–49 | 50–64 | 65+ |
|---|---|---|---|---|
| YouTube | 95% | 91% | 85% | 65% |
| 69% | 78% | 71% | 59% | |
| 79% | 64% | 41% | 21% | |
| TikTok | 65% | 45% | 31% | 11% |
In the UK, Ofcom found that 89% of adult internet users use at least one social media platform, rising to 97% among 16- to 34-year-olds (Ofcom, April 2026).
Social media usage by gender
- Overall: female users are 50.5% of UK identities and 51.1% of US identities. In India, 40.5% of adult identities are female (DataReportal, October 2026).
- UK ad audiences: Pinterest 71.2% female, TikTok 67.4% female, LinkedIn 54.3% male and X 63.3% male (DataReportal, late 2026; ad audiences, not users).
- US survey: women are more likely to use Facebook, Instagram and TikTok, and men are more likely to use X and Reddit (Pew, 2025).
Social media usage among teenagers
Pew’s December 2025 survey of US teens (13 to 17) found YouTube far ahead. 21% said they use TikTok “almost constantly” and 17% said the same of YouTube. 64% had used an AI chatbot (summary of Pew’s report). One popular chatbot is covered in our guide on how many people use Character AI.
Share of US teens (13–17) who use each platform
For younger UK children, a government answer to Parliament in April 2026 said children aged 8 to 14 spend an average of 45 minutes a day on Snapchat and 15 on TikTok, against 4 on Instagram and 3 on Facebook (DSIT, 16 April 2026).
Which age group uses social media the most?
Young adults use the most platforms and use them most often, but the pattern depends on the platform. Facebook is used by more US adults aged 30 to 49 (78%) than those aged 18 to 29 (69%), while Instagram and TikTok skew young. About half of US adults aged 18 to 29 use TikTok daily, against 5% of those aged 65 and over (Pew, 2025). Audience size and engagement are different questions: a platform with fewer users can still win on minutes per user, as the next section shows.
Average Time Spent on Social Media
How much time do people spend on social media daily?
GWI data in DataReportal’s October 2026 update puts average use at 19 hours 18 minutes a week. That is about 2 hours 45 minutes a day (our calculation). DataReportal’s Digital 2026 report, published a year earlier, gave 18 hours 36 minutes, so time spent has edged up if the definition is unchanged. These are survey answers from internet users aged 16 and over.
Do not confuse this with total online time. Ofcom found that UK adults spend 4 hours 30 minutes a day online in total, up 10 minutes on 2024, and most of it on a smartphone (Online Nation 2025).
Average time spent on each social media platform
Daily minutes among Android users of each app, worldwide
UK adults: average minutes a day per visitor (May 2025)
Which social media platform has the highest engagement?
By minutes per user, TikTok leads the global Android data, ahead of YouTube. In the UK, YouTube leads both reach and time across all adults, according to Ofcom. Facebook and WhatsApp reach more people than they hold for long. Engagement and audience size rank platforms differently, so choose the measure that fits your question.
Social media usage trends
- Mobile first: most online time in the UK is on a smartphone (Ofcom, 2025).
- Short-form video: TikTok tops time per user, and YouTube said in June 2025 that Shorts averaged more than 200 billion daily views.
- Messaging: 74% of UK online adults used WhatsApp every day in May 2025, against 23% for Facebook Messenger (Ofcom).
- Less posting: Ofcom found 49% of UK adult social media users post, share or comment, down from 61% in 2024 (reported here).
Social Media Statistics by Country
| Country | Internet users | Social media user identities | Identities as % of population | % of internet users on social media |
|---|---|---|---|---|
| India | 1.04 billion (70.0%) | 573 million | 38.7% | 55.3% |
| United States | 331 million (94.7%) | 268 million | 76.7% | 81.0% |
| United Kingdom | 68.5 million (97.8%) | 59.0 million | 84.3% | 86.2% |
Social media user identities as a share of population (October 2026)
Social media statistics in India
- India has 573 million identities, up 73 million (+14.6%) in a year. That is 38.7% of the population and only 55.3% of internet users, which leaves room for growth.
- Adults: 526 million identities, equal to 50.0% of people aged 18 and over; 59.5% are male.
- Most-used platforms (GWI, Q2 2026): WhatsApp 87.7%, YouTube 84.3%, Instagram 82.0%, Facebook 71.6% and Telegram 52.6% of internet users aged 16+.
- Ad reach: YouTube 573 million, Instagram 515 million, Facebook 400 million and Snapchat 221 million.
Social media statistics in the United States
- The US has 268 million identities, up 14 million (+5.5%) in a year, equal to 76.7% of the population and 84.1% of adults.
- Most-used platforms (GWI, Q2 2026): Facebook 74.7%, YouTube 60.7%, Instagram 59.5%, Messenger 56.2% and TikTok 47.2%.
- Pew’s adult survey gives a different picture because it asks people directly: 84% use YouTube, 70% Facebook and 51% Instagram (Pew, 2026). Survey and identity figures are not interchangeable.
Social media statistics in the United Kingdom
- The UK has 59.0 million identities, up 3.5 million (+6.3%) in a year. That is 84.3% of the population. 86.2% of UK internet users use at least one platform.
- Ofcom reports that 89% of adult internet users use at least one platform, and 97% of 16- to 34-year-olds do.
- Ad reach: YouTube 59.0 million, LinkedIn 53.0 million registered members, Facebook 38.1 million, Instagram 33.7 million and Reddit 31.6 million.
UK: share of online adults aged 16+ using each platform monthly
Internet and Website Statistics in 2026
How many people use the internet worldwide?
There were 6.15 billion internet users at the start of October 2026, or 73.9% of the world’s population. The number grew by 54 million (+0.9%) in a year (DataReportal).
How many websites are there in the world?
There is no single answer, because “website” can mean three different things. Netcraft’s July 2026 survey counted about 1.49 billion sites (hostnames that responded), across 305 million domains and 14.8 million web-facing computers (Netcraft). Only a small share of those hostnames serve real content.
Three ways to count the web (millions)
How many active websites are there?
An active website serves real, distinct content rather than a parked or duplicate page. Netcraft does not publish an absolute count of active sites. A third-party calculation from its data gives about 216.7 million in July 2026, or roughly 14.5% of responding hostnames. Treat it as an estimate.
How many domain names are registered worldwide?
Domain registrations passed 400 million for the first time in Q2 2026, closing at 401.6 million on 30 June 2026. That was up 9.1 million (+2.3%) on the quarter and 29.9 million (+8.1%) on the year. .com accounted for 166.6 million and .net for 12.5 million, and country-code domains for 148.6 million. .uk is the third-largest country-code domain, after .cn and .de (Verisign). A registered domain is not necessarily a live website.
WhatsApp and Messaging Statistics
WhatsApp user statistics
WhatsApp reached 2 billion monthly users in 2020 and passed 3 billion in April 2025, the last figure Meta has given. In the UK, 90% of online adults used it in May 2025, up from 87% in 2024, and people averaged 17 minutes a day on it (Ofcom). In India, 87.7% of internet users aged 16+ used it in the past month (GWI, Q2 2026).
How do people use messaging platforms?
Messaging is now a daily habit rather than an occasional one. In the UK, 74% of online adults used WhatsApp on an average day in May 2025, up from 64% a year earlier, while daily use of Facebook Messenger fell to 23% from 30%. Telegram claims more than 1 billion monthly users, and WhatsApp has a large business arm, but neither publishes call or group-chat splits we could verify.
WhatsApp data usage
WhatsApp says calls use your phone’s internet connection, so data charges may apply. On Android, Data Saver lowers the quality of received video in one-to-one cellular video calls. It does not apply to Wi-Fi, group calls or voice calls. To see what you have used, go to Settings > Storage and data > Network usage. WhatsApp does not publish a single per-minute figure, and independent tests vary. See the official WhatsApp Data Saver help page.
Why Do Social Media Statistics Differ Between Sources?
Most disagreements come from dates, metrics or scope, not from errors. The table shows the common cases.
| Figures you may see | Why they differ | How to read them |
|---|---|---|
| 5.66B, 5.79B and 5.81B social media users | Different reporting periods: October 2025, April 2026, October 2026 | All valid for their own date |
| Facebook 3.07B and 3.64B | 3.07B is Facebook-only monthly users (December 2023); 3.64B is daily people across all Meta apps (September 2026) | Not comparable |
| Instagram 3B, 2B and 1.96B | Monthly users, daily users and advertising reach | Three different metrics |
| X 550M and 600M | 550M covers X and Grok combined (March 2026); 600M was an earlier company claim | Use the filing, with its caveat |
| TikTok 1.6B to 2B+ | No routine public figure; providers use different models | Treat as estimates |
| Websites 1.49B, 402M and 217M | Hostnames, registered domains and active sites | Check what is being counted |
Duplicate and automated accounts
Identity counts include duplicates, and companies regularly clean up fake or spam accounts. DataReportal notes that several platforms’ US ad reach fell in 2026, which may reflect account corrections rather than a real drop in use (DataReportal US). Exact human-only counts are rarely public.
Changes in platform reporting
- Meta stopped routine per-app user reporting after Q4 2023. Instagram and WhatsApp figures now come mainly from earnings-call remarks.
- X published little routine user data until SpaceX’s S-1 filing in May 2026, which combines X and Grok.
- Reddit reports “uniques”, not users, and now leads with weekly as well as daily figures.
- Snap plans to lead with monthly users from Q1 2027.
How to Verify Social Media Statistics
Best sources for official social media statistics
- Meta Investor Relations: daily active people and quarterly results.
- Reddit Investor Relations: daily and weekly active uniques.
- Pinterest Investor Relations: monthly active users by region.
- Alphabet Investor Relations: YouTube revenue (no user count).
- DataReportal: compiled global and country estimates.
- Pew Research Center: US adult and teen surveys.
- GWI: global consumer surveys.
- Ofcom: UK online habits (Online Nation, published each December).
How to check whether a social media statistic is current
- Check the publication date, and the date the figure covers.
- Find the original source, not the page that quoted it.
- Confirm the metric: MAU, DAU, DAP, uniques, registered accounts or ad reach.
- Confirm the geography, and whether it covers one app or a company’s apps combined.
- Check whether it is company-reported, survey-based or estimated.
How often should social media statistics be updated?
| Source | Update rhythm |
|---|---|
| Meta, Reddit, Pinterest, Snap results | Quarterly |
| DataReportal global and country reports | Annually (October to November), with a mid-year update in April |
| Pew Research Center | Roughly annually |
| Ofcom Online Nation | Annually, in December |
| Netcraft web server survey | Monthly |
| Verisign Domain Name Industry Brief | Quarterly |
Frequently Asked Questions About Social Media Statistics
How many people use social media worldwide in 2026?
There were 5.81 billion social media user identities at the start of October 2026, equal to 69.9% of the world’s population (DataReportal). These are accounts, not unique people.
What is the most popular social media platform in the world?
It depends on the measure. Facebook leads self-reported use (58.1% of internet users aged 16+), YouTube has the largest ad reach (2.77 billion) and WhatsApp tops DataReportal’s app-usage index. The top four are close.
Which social media platform has the most active users?
No single ranking is reliable, because platforms report different metrics. Facebook, Instagram and WhatsApp each have 3 billion or more monthly users by company statements and last-reported figures, and YouTube does not publish a count.
How many people use Facebook?
Meta’s last Facebook-only figure was 3.07 billion monthly users in December 2023. Meta now reports 3.64 billion daily active people across all its apps (September 2026).
How many monthly active users does Instagram have?
Instagram has more than 3 billion monthly active users, announced in September 2025, and 2 billion daily active users, stated in July 2026.
How many daily active users does X have?
Not publicly confirmed. X and Grok together had about 550 million monthly active users on 31 March 2026, according to SpaceX’s filing.
How many people use Reddit?
Reddit had 130.3 million daily active uniques and 515.2 million weekly active uniques in Q3 2026.
How many social media platforms does the average person use?
About 6.7 a month, according to GWI data in DataReportal’s October 2026 update.
What percentage of the world’s population uses social media?
69.9%, counting identities rather than unique people (DataReportal, October 2026). Among internet users it is 94.5%.
What age group uses social media the most?
Adults aged 18 to 29 are the heaviest users of Instagram, TikTok and Snapchat. Facebook peaks among US adults aged 30 to 49. In the UK, 97% of 16- to 34-year-olds use social media (Ofcom).
How much time does the average person spend on social media?
About 19 hours 18 minutes a week, or around 2 hours 45 minutes a day (GWI via DataReportal). UK adults spend 4 hours 30 minutes a day online in total (Ofcom).
Which country has the highest social media usage?
China and India have the largest totals (Business Today). By share of population, wealthier countries lead: the UK is at 84.3%, the US at 76.7% and India at 38.7%.
How many websites are there in 2026?
About 1.49 billion hostnames responded to Netcraft’s July 2026 survey, but only around 217 million are estimated to be active. There were 401.6 million registered domain names at the end of June 2026.
Are social media user statistics the same as advertising reach?
No. Ad reach is the potential audience shown in a platform’s ad tool. It can be higher or lower than active users and changes when platforms clean up accounts.
Sources and Last Updated Information
We prefer company filings and results, then named research bodies. Third-party and survey figures are labelled. Where a reliable current figure is not public, we write “not publicly confirmed” rather than use an unsourced number. Every figure was checked on 7 November 2026.
| Source | Used for | Type |
|---|---|---|
| DataReportal | Global, country and ad-reach figures; GWI survey data | Third-party compiled |
| Meta Q3 2026 results | Daily active people | Company-reported |
| Reddit Q3 2026 results | Daily and weekly active uniques | Company-reported |
| Pinterest Q3 2026 results | Monthly active users | Company-reported |
| Snap Q3 2026 10-Q | Daily and monthly active users | Company-reported |
| SpaceX S-1 | X and Grok monthly active users | Company filing |
| Pew Research Center | US adult and teen platform use | Survey |
| Ofcom Online Nation 2025 | UK reach and time spent | Panel measurement |
| Netcraft | Hostnames and domains responding | Third-party measurement |
| Verisign | Registered domain names | Registry data |
Social Media Statistics Update Log
| Date updated | What changed |
|---|---|
| 7 November 2026 | Initial publication |
| Next update | Latest quarterly platform figures after Meta, Reddit, Pinterest and Snap report |
| Next annual review | Global audience and demographic statistics after DataReportal’s next annual report |